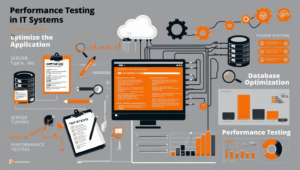
Header image

SupremeTech’s Expertise in the Process of Performance Testing

10/12/2024

132

Vu Nguyen Q.

In the previous article discussing The Importance of Performance Testing and SupremeTech’s Expertise, we understood the overview of performance testing and its significance for businesses. Let me introduce how SupremeTech manages performance and the process of performance testing to ensure our products are always ready to face real-world challenges.

At SupremeTech, product performance is not just a priority but a commitment. So how to do performance testing? Below is a detailed process of performance testing that we implement to ensure applications operate stably and efficiently under any usage conditions.

For more insights into Performance Testing, check out our blogs below:

How to do performance testing

Step 1: Application Optimization

  1.1 Optimizing OPCache

Infrastructure Team

  • Responsible for configuring and fine-tuning OPCache on the server.
  • Ensures that JIT (Just-In-Time) caching is enabled and that parameters align with system resources.

1.2 Database Optimization

Back End Team

  • Designs composite indexes to enhance query speed.
  • Rewrites or optimizes SQL queries to improve efficiency and reduce execution time.
  • Analyzes common queries and data flows.

1.3 Optimizing Laravel During Deployment

Back End Team

  • Considers activating Production Mode in Laravel.
  • Executes the command php artisan optimize to optimize application configurations.

Infrastructure Team

  • Manages caching for configurations, routes, and views.
  • Supports the deployment and integration of queues or jobs on the server system.

Step 2: Preparing for Performance Testing

Collaboration among teams is crucial to ensure that every preparation step is accurate and ready for the performance testing process.

2.1 Developing a Plan and Initial Estimates

QC Team, Back-End Team

  • Creates a detailed plan for each phase of performance testing.
  • Proposes resource, time, and data requirements.

Project Technical Leader (PTL)

  • Reviews and approves the testing plan.
  • Coordinates appropriate resources based on preliminary estimates.

2.2 Security Checklist

Project Technical Leader (PTL)

  • Develops a checklist of security factors to protect the system during testing.

QC Team, Back End Team

  • Review the checklist to ensure completeness and accuracy.

2.3 Preparing Test Data

QC Team

  • Creates accounts, test data, and detailed test scenarios.
  • Writes test scripts to automate testing steps.

Back End Team

  • Assists in building complex test data or necessary APIs.
  • Reviews and tests scripts to ensure logic aligns with the actual system.

Step 3: Setting Up the Testing Environment

Coordination between the QC and Infrastructure teams is essential to ensure an optimized testing environment is ready for subsequent phases.

3.1 Estimating Server Specifications

Infrastructure Team

  • Determines appropriate server configurations based on application needs and testing requirements.
  • Provides optimal specifications based on available resources and product scale.
  • Supplies information about physical resources and infrastructure to support testing.

3.2 Establishing the Testing Environment

Infrastructure Team

  • Installs and configures virtual machines for performance testing.
  • Adjusts server parameters (CPU, RAM, Disk I/O) to meet testing criteria.

QC Team

  • Confirms that the environment is ready for testing based on established criteria.

3.3 Adjusting Parameters According to Testing Requirements

Infrastructure Team

  • Modifies server configurations based on optimal parameters suggested after initial tests.
  • Ensures configuration changes do not affect system stability.

Step 4: Conducting Tests

4.1 Performing Performance Tests

QC Team

  • Executes load tests on APIs and key functionalities.
  • Utilizes testing tools (JMeter, k6, Postman, etc.) to measure performance.

Infrastructure Team

  • Supports environment management and monitors system resources during testing.

4.2 Reporting Results

QC Team, Infrastructure Team

  • Compiles test results (response times, CPU load, RAM usage, etc.) from various tools.
  • Compares results against established performance targets.
  • Sends detailed reports to stakeholders (PTL, Backend Team).

4.3 Post-Test Optimization

Backend Team

  • Analyzes test results and fixes bugs or optimizes source code and application logic.

Infrastructure Team

  • Adjusts server configurations or optimizes system resources based on test outcomes.

QC Team

  • Re-run tests after optimization to ensure improved performance is achieved.
  • Compiles final test results and confirms with stakeholders.

Step 5: Clearing Test Data

5.1 Restoring Server Configuration to Initial State

Infrastructure Team

  • Resets server configurations to their original state to reduce unnecessary resource consumption.
  • Deletes or powers down virtual machines used during testing.
  • Ensures no temporary configurations or unnecessary test environments remain in the system.

5.2 Removing All Test Data from Databases

QC Team

  • Identifies test data that needs deletion to prevent junk data from affecting the live system.

Back End Team

  • Safely deletes test data from the database while ensuring no production data is mistakenly removed.
  • Verifies that the database is clean after deletion.
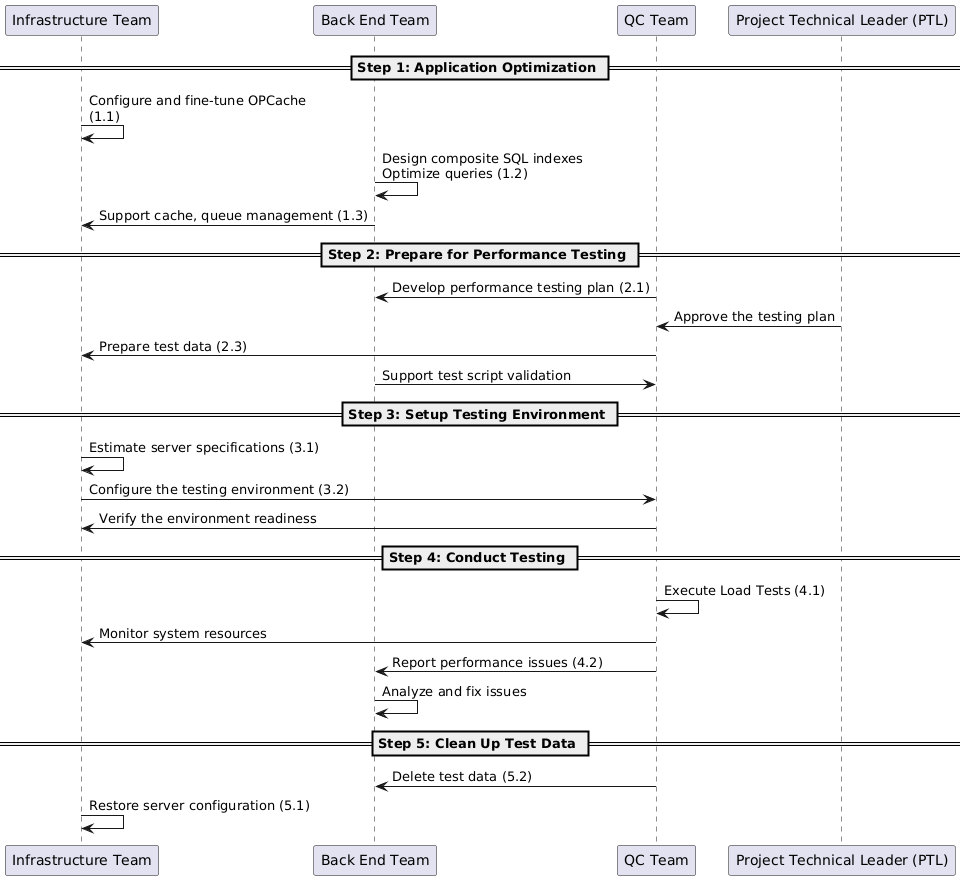
5 steps of process of performance testing

This process of performance testing enables SupremeTech to optimize each stage effectively, ensuring our products achieve optimal performance before delivery to partners. With our experienced workforce, we consistently prioritize product efficiency and quality.

Related Blog

Knowledge

+0

    The Importance of Performance Testing and SupremeTech’s Expertise

    Hello everyone, I’m Vu, a dedicated Quality Control professional committed to delivering software and applications that provide the best user experience. With over 12 years of experience in the industry, I am excited to share valuable insights on Performance Testing—an essential step to ensure that software functions smoothly and effectively before it reaches users. Even a slight delay can lead to customer loss in today's fast-paced era, making performance testing crucial for all businesses. How can systems maintain smooth operation during unexpected traffic spikes? How can we prevent crashes during peak times? The solution lies in performance testing. At SupremeTech, we provide high-quality performance testing solutions that guarantee your systems remain stable and efficient. 6 Notable Technology Incidents From the Past Healthcare.gov (2013): This insurance website crashed completely when it launched, leading to significant confusion among American citizens.Amazon Prime Day (2018): The e-commerce giant lost substantial revenue on the epic sale because the platform had crashed.Google Cloud (2019): A configuration issue caused Google Cloud to crash, affecting numerous primary services and highlighting the importance of performance testing.Zoom During the Covid Pandemic (2020): To meet the surge in online work demand, Zoom had to build its infrastructure rapidly.Facebook Outage (2021): A configuration error caused the entire Meta ecosystem to go down for 6 hours, resulting in significant reputational and financial losses.PlayStation Network (2023): Shortly after launching a new game on PlayStation 5, Sony was unprepared for gamers' inability to download it. These incidents serve as a wake-up call for all businesses. No system is immune to performance issues if it hasn't been thoroughly tested and optimized. Here are some key reasons why companies should prioritize Performance Testing for their products: Prevent Revenue Loss: A slow or crashing system can drive customers away, leading to lost revenue.Protect Brand Reputation: Major performance incidents often leave a negative impression, damaging credibility.Prepare for Growth: Testing allows you to scale operations confidently without worrying about system issues. What is Performance Testing? Performance testing is a method of testing, measuring, and evaluating a system's speed, stability, and load capacity to ensure it operates effectively under various conditions. Overview of Performance Testing: Load Capacity Assessment: Determining the maximum load limit that the system can handle.Identifying Bottlenecks: Finding weaknesses as a way to enhance performance.Improving User Experience: Ensuring users have a smooth experience while protecting brand reputation. Types of Performance Testing Load Testing: Evaluating load capacity by simulating large numbers of concurrent users. We identify the system's load threshold and address weaknesses before issues arise.Stress Testing: Pushing the system to its maximum limits to test its response in worst-case scenarios, ensuring safety.Endurance Testing: Assessing system durability when operating continuously over long periods to ensure stable performance.Spike Testing: Simulating sudden spikes in traffic, such as during major sales campaigns, helping businesses prepare for peak hours. SupremeTech's Exceptional Capabilities Flexible Integration with Various Platforms: We can conduct tests across diverse platforms, from mobile applications and websites to complex systems, ensuring optimal performance for all platforms.Detailed Data Analysis: We not only identify bugs but also provide detailed reports with optimization recommendations based on real data.  This helps you effectively address performance issues.Flexible Automated Updates: SupremeTech's automated systems allow businesses to adjust and optimize their processes easily as they grow.Dedicated Consulting Team: SupremeTech's experienced experts are ready to support you from planning through implementation and maintain high efficiency. SupremeTech - Your Partner for Optimal Performance At SupremeTech, we are committed to researching advanced technologies, maintaining professional workflows, and employing a passionate team to deliver exceptional value in all our products and services. Performance testing is more than just a technical task; it is essential for maintaining your reputation and achieving market success. Allow SupremeTech to enhance your products for today and the future. For more insights into Performance Testing, check out our blogs below: The Process of Performance Testing at SupremeTechThe Ultimate Guide to an Essential JMeter Performance Testing ToolPerform API Testing using Postman

    10/12/2024

    113

    Vu Nguyen Q.

    Knowledge

    +0

      The Importance of Performance Testing and SupremeTech’s Expertise

      10/12/2024

      113

      Vu Nguyen Q.

      Knowledge

      Software Development

      +0

         Exploring API Performance Testing with Postman

        Hello, tech enthusiasts and creative developers! I’m Vu, the author of SupremeTech’s performance testing series. In the article “The Ultimate Guide to JMeter Performance Testing Tool,” we explored JMeter's strengths and critical role in performance testing. Today, I’m introducing an exciting and straightforward way to do API performance testing using Postman. What is Postman? Postman is a robust API (Application Programming Interface) platform that empowers developers to quickly design, test, document, and interact with APIs. It is a widely used tool for testing APIs, which is valuable in software development, primarily web or mobile app development. Why Use Postman for API Testing? Postman is favored by software developers, testers, and API specialists because of its many advantages: User-Friendly Interface: Postman’s intuitive design makes it easy to use.Supports Diverse HTTP Methods: It handles requests such as GET, POST, PUT, DELETE, PATCH, OPTIONS, and more.Flexible Configuration: Easily manage API request headers, parameters, and body settings.Test Automation with Scripts: Write JavaScript code within the Tests tab to automate API response validation.Integration with CI/CD: Postman's CLI tool, Newman, seamlessly integrates with CI/CD pipelines, enabling automated API testing in development workflows.API Documentation and Sharing: Create and share API documentation with team members or clients effortlessly. Performance API Testing on Postman As of mid-2024, Postman introduced a new feature allowing users to perform API performance testing quickly and conveniently. With just a few simple steps, you can evaluate your API’s performance under high load and ensure its strength. Step 1: Select the Collection for Performance Testing Open Postman and navigate to the Collections tab on the left sidebar.Choose the Collection or Folder you want to test. Step 2: Launch the Collection Runner After selecting your desired Collection or Folder, click Run Collection to open the Collection Runner window.In the Runner, select the APIs you want to include in the performance test.Switch to the Performance tab and choose a simulation method:Fixed: Simulates a fixed number of users.Ramp Up: Starts with a few users and gradually increases.Spike: Introduces a sudden surge in traffic followed by a reduction.Peak: Increases traffic to a high level and sustains it for a period. Step 3: Adjust Virtual Users and Test Duration Configure the Virtual Users and Test Duration settings to simulate the desired load.Start with smaller values, then gradually increase them to gain a clear understanding of your API's performance under varying conditions. Step 4: Run the Test Click Run to start the performance test.During the test, Postman will send API requests and provide real-time data on:Response Time: The API's duration to respond to a request.Error Rate: The percentage of failed requests.Throughput: The number of API requests the system can handle per second. Step 5: Analyze the Report Once the test is complete, Postman generates a detailed report, including: Response Time: Tracks the duration it takes for APIs to process requests.Error Rate: Highlights any issues encountered during testing.Throughput: Measures the system's capacity to process requests under load. Use these metrics to evaluate whether your API performs efficiently under heavy traffic. These insights will guide you in optimizing your API for better performance. Leverage Customization for Realistic User Simulation Postman allows you to customize request data for each virtual user. You can upload a CSV or JSON file with unique datasets if you want different data for each user. This feature enables a more accurate simulation of real-world user behavior. After each test run, Postman provides an easy-to-understand report highlighting the areas for improvement. You can track performance changes and compare test results to identify weaknesses and refine your API. Test and Optimize Your API with Postman With Postman’s new performance testing feature, API optimization has never been easier. It helps you quickly identify and address potential issues to ensure your system is always ready to handle user demands effectively and reliably.   For more details and step-by-step guidance, check out the following resources on the Postman website:   OverviewRun a performance testView performance test metricsDebug performance test errorsInject data into virtual users Start your API performance optimization journey with Postman and prepare your system to meet every demand seamlessly. >>> Explore more articles about performance testing: SupremeTech’s Expertise in the Process of Performance Testing

        23/12/2024

        90

        Vu Nguyen Q.

        Knowledge

        +1

        • Software Development

         Exploring API Performance Testing with Postman

        23/12/2024

        90

        Vu Nguyen Q.

        Knowledge

        +0

          The Ultimate Guide to JMeter Performance Testing Tool

          At SupremeTech, we are dedicated to creating technology products that provide the best user experience. In this article, I will introduce you to JMeter performance testing, a powerful and flexible tool that significantly enhances the quality of technology products. With its ability to support various protocols, JMeter allows you to test the performance of a wide range of applications, from web services to APIs and even real-time applications. Let’s explore the types of applications JMeter can be applied to and the outstanding features it offers! For more insights into Performance Testing, check out our blogs below: The Process of Performance Testing at SupremeTechPerform API Testing using Postman Applications Suitable for JMeter Web Applications For applications using HTTP/HTTPS protocols, such as e-commerce sites, blogs, or corporate websites, JMeter can help assess response times and system performance. RESTful APIs JMeter supports load testing for APIs, measuring response times, and checking stability. Real-Time Applications (WebSocket Applications) For applications that require real-time communication, such as chat applications or online games, JMeter offers performance testing with the WebSocket Sampler Plugin, ideal for messaging systems or online monitoring. Mobile Applications JMeter can simulate requests from mobile applications to their backend APIs, such as food delivery apps or digital banking services. Database-Driven Applications For applications that rely on database queries, like CRM or ERP systems, JMeter supports performance testing using the JDBC Request Plugin to evaluate database efficiency. Custom Protocol Applications For applications using unique protocols like TCP or UDP, JMeter allows for performance simulation and testing using the TCP Sampler, which benefits  IoT applications or data transmission over local networks. Why Should Use JMeter Performance Testing Tool? Advantages Free and open source: JMeter is a cost-free tool that is easy to use.Multi-protocol support: It supports protocols like HTTP, FTP, SOAP, REST, etc.User-friendly interface: It provides an intuitive graphical interface suitable for beginners.Scalability: Supports plugins and can integrate with CI/CD tools like Jenkins.Detailed measurement: Offers comprehensive reports on performance metrics such as latency, error rates, and response times.Distributed testing: Allows load testing across multiple servers to simulate high traffic volumes. Disadvantages    Performance limitations under heavy load: JMeter may struggle with extremely high loads due to resource consumption.Not optimized for UI testing: JMeter might not be the best choice if you need to test complex user interfaces.Limited scripting flexibility: While it uses BeanShell and Groovy scripts, it lacks the flexibility of some other tools.Complex result analysis: Default reports from JMeter may not be intuitive and require external tools for advanced analysis.Learning curve: The complex features of JMeter can take time to master. What You Should Know About JMeter Plugins Plugins are an integral part of JMeter that significantly enhance its testing capabilities. Some notable plugins include: JMeter Plugins Manager: Easily manage plugins without manual configuration.PerfMon Metrics Collector: Monitors system resources like CPU, RAM, Disk, and Network during tests.JDBC Request Plugin: Tests database performance through JDBC.WebSocket Sampler: Supports WebSocket protocol testing for real-time applications.Throughput Shaping Timer: Adjusts request rates to achieve desired throughput.ElasticSearch Backend Listener: Integrates with ElasticSearch and Kibana for data analysis and visualization. Types of Reports Provided by JMeter JMeter offers various reports to help analyze and evaluate system performance: Dashboard Report: Provides an overview with graphs and data tables to track throughput, response times, and error rates.Aggregate Report: Supplies detailed aggregated data about each sampler or group of requests.Graph Results: Displays graphs showing changes in response times and throughput over time.Response Time Distribution: Shows response time distribution to identify acceptable thresholds. JMeter is a necessary tool for testers performing performance testing across various applications and protocols. Despite some limitations, its support for plugins and detailed reporting makes monitoring and analyzing system performance easy. Best of all, it is completely free! Make the most of JMeter to ensure your application runs smoothly in testing and production environments.

          10/12/2024

          141

          Vu Nguyen Q.

          Knowledge

          +0

            The Ultimate Guide to JMeter Performance Testing Tool

            10/12/2024

            141

            Vu Nguyen Q.

            Knowledge

            +0

              Best Practices for Building Reliable AWS Lambda Functions

              Welcome back to the "Mastering AWS Lambda with Bao" series! The previous episode explored how AWS Lambda connects to the world through AWS Lambda triggers and events. Using S3 and DynamoDB Streams triggers, we demonstrated how Lambda automates workflows by processing events from multiple sources. This example provided a foundation for understanding Lambda’s event-driven architecture. However, building reliable Lambda functions requires more than understanding how triggers work. To create AWS lambda functions that can handle real-world production workloads, you need to focus on optimizing performance, implementing robust error handling, and enforcing strong security practices. These steps optimize your Lambda functions to be scalable, efficient, and secure. In this episode, SupremeTech will explore the best practices for building reliable AWS Lambda functions, covering two essential areas: Optimizing Performance: Reducing latency, managing resources, and improving runtime efficiency.Error Handling and Logging: Capturing meaningful errors, logging effectively with CloudWatch, and setting up retries. Adopting these best practices, you’ll be well-equipped to optimize Lambda functions that thrive in production environments. Let’s dive in! Optimizing Performance Optimize the Lambda function's performance to run efficiently with minimal latency and cost. Let's focus first on Cold Starts, a critical area of concern for most developers. Understanding Cold Starts What Are Cold Starts? A Cold Start occurs when AWS Lambda initializes a new execution environment to handle an incoming request. This happens under the following circumstances: When the Lambda function is invoked for the first time.After a period of inactivity (execution environments are garbage collected after a few minutes of no activity – meaning it will be shut down automatically).When scaling up to handle additional concurrent requests. Cold starts introduce latency because AWS needs to set up a new execution environment from scratch. Steps Involved in a Cold Start: Resource Allocation:AWS provisions a secure and isolated container for the Lambda function.Resources like memory and CPU are allocated based on the function's configuration.Execution Environment Initialization:AWS sets up the sandbox environment, including:The /tmp directory is for temporary storage.Networking configurations, such as Elastic Network Interfaces (ENI), for VPC-based Lambdas.Runtime Initialization:The specified runtime (e.g., Node.js, Python, Java) is initialized.For Node.js, this involves loading the JavaScript engine (V8) and runtime APIs.Dependency Initialization:AWS loads the deployment package (your Lambda code and dependencies).Any initialization code in your function (e.g., database connections, library imports) is executed.Handler Invocation:Once the environment is fully set up, AWS invokes your Lambda function's handler with the input event. Cold Start Latency Cold start latency varies depending on the runtime, deployment package size, and whether the function runs inside a VPC: Node.js and Python: ~200ms–500ms for non-VPC functions.Java or .NET: ~500ms–2s due to heavier runtime initialization.VPC-Based Functions: Add ~500ms–1s due to ENI initialization. Warm Starts In contrast to cold starts, Warm Starts reuse an already-initialized execution environment. AWS keeps environments "warm" for a short time after a function is invoked, allowing subsequent requests to bypass initialization steps. Key Differences: Cold Start: New container setup → High latency.Warm Start: Reused container → Minimal latency (~<100ms). Reducing Cold Starts Cold starts can significantly impact the performance of latency-sensitive applications. Below are some actionable strategies to reduce cold starts, each with good and bad practice examples for clarity. 1. Use Smaller Deployment Packages to optimize lambda function Good Practice: Minimize the size of your deployment package by including only the required dependencies and removing unnecessary files.Use bundlers like Webpack, ESBuild, or Parcel to optimize your package size.Example: const DynamoDB = require('aws-sdk/clients/dynamodb'); // Only loads DynamoDB, not the entire SDK Bad Practice: Bundling the entire AWS SDK or other large libraries without considering modular imports.Example: const AWS = require('aws-sdk'); // Loads the entire SDK, increasing package size Why It Matters: Smaller deployment packages load faster during the initialization phase, reducing cold start latency. 2. Move Heavy Initialization Outside the Handler Good Practice: Place resource-heavy operations, such as database or SDK client initialization, outside the handler function so they are executed only once per container lifecycle – a cold start.Example: const DynamoDB = new AWS.DynamoDB.DocumentClient(); exports.handler = async (event) => {     const data = await DynamoDB.get({ Key: { id: '123' } }).promise();     return data; }; Bad Practice: Reinitializing resources inside the handler for every invocation.Example: exports.handler = async (event) => {     const DynamoDB = new AWS.DynamoDB.DocumentClient(); // Initialized on every call     const data = await DynamoDB.get({ Key: { id: '123' } }).promise();     return data; }; Why It Matters: Reinitializing resources for every invocation increases latency and consumes unnecessary computing power. 3. Enable Provisioned Concurrency1 Good Practice: Use Provisioned Concurrency to pre-initialize a set number of environments, ensuring they are always ready to handle requests.Example:AWS CLI: aws lambda put-provisioned-concurrency-config \ --function-name myFunction \ --provisioned-concurrent-executions 5 AWS Management Console: Why It Matters: Provisioned concurrency ensures a constant pool of pre-initialized environments, eliminating cold starts entirely for latency-sensitive applications. 4. Reduce Dependencies to optimize the lambda function Good Practice: Evaluate your libraries and replace heavy frameworks with lightweight alternatives or native APIs.Example: console.log(new Date().toISOString()); // Native JavaScript API Bad Practice: Using heavy libraries for simple tasks without considering alternatives.Example: const moment = require('moment'); console.log(moment().format()); Why It Matters: Large dependencies increase the deployment package size, leading to slower initialization during cold starts. 5. Avoid Unnecessary VPC Configurations Good Practice: Place Lambda functions outside a VPC unless necessary. If a VPC is required (e.g., to access private resources like RDS), optimize networking using VPC endpoints.Example:Use DynamoDB and S3 directly without placing the Lambda inside a VPC. Bad Practice: Deploying Lambda functions inside a VPC unnecessarily, such as accessing services like DynamoDB or S3, which do not require VPC access.Why It’s Bad: Placing Lambda in a VPC introduces additional latency due to ENI setup during cold starts. Why It Matters: Functions outside a VPC initialize faster because they skip ENI setup. 6. Choose Lightweight Runtimes to optimize lambda function Good Practice: Use lightweight runtimes like Node.js or Python for faster initialization than heavier runtimes like Java or .NET.Why It’s Good: Lightweight runtimes require fewer initialization resources, leading to lower cold start latency. Why It Matters: Heavier runtimes have higher cold start latency due to the complexity of their initialization process. Summary of Best Practices for Cold Starts AspectGood PracticeBad PracticeDeployment PackageUse small packages with only the required dependencies.Bundle unused libraries, increasing the package size.InitializationPerform heavy initialization (e.g., database connections) outside the handler.Initialize resources inside the handler for every request.Provisioned ConcurrencyEnable provisioned concurrency for latency-sensitive applications.Ignore provisioned concurrency for high-traffic functions.DependenciesUse lightweight libraries or native APIs for simple tasks.Use heavy libraries like moment.js without evaluating lightweight alternatives.VPC ConfigurationAvoid unnecessary VPC configurations; use VPC endpoints when required.Place all Lambda functions inside a VPC, even when accessing public AWS services.Runtime SelectionChoose lightweight runtimes like Node.js or Python for faster initialization.Use heavy runtimes like Java or .NET for simple, lightweight workloads. Error Handling and Logging Error handling and logging are critical for optimizing your Lambda functions are reliable and easy to debug. Effective error handling prevents cascading failures in your architecture, while good logging practices help you monitor and troubleshoot issues efficiently. Structured Error Responses Errors in Lambda functions can occur due to various reasons: invalid input, AWS service failures, or unhandled exceptions in the code. Properly structured error handling ensures that these issues are captured, logged, and surfaced effectively to users or downstream services. 1. Define Consistent Error Structures Good Practice: Use a standard error format so all errors are predictable and machine-readable.Example: {   "errorType": "ValidationError",   "message": "Invalid input: 'email' is missing",   "requestId": "12345-abcd" } Bad Practice: Avoid returning vague or unstructured errors that make debugging difficult. { "message": "Something went wrong", "error": true } Why It Matters: Structured errors make debugging easier by providing consistent, machine-readable information. They also improve communication with clients or downstream systems by conveying what went wrong and how it should be handled. 2. Use Custom Error Classes Good Practice: In Node.js, define custom error classes for clarity: class ValidationError extends Error {   constructor(message) {     super(message);     this.name = "ValidationError";     this.statusCode = 400; // Custom property   } } // Throwing a custom error if (!event.body.email) {   throw new ValidationError("Invalid input: 'email' is missing"); } Bad Practice: Use generic errors for everything, making identifying or categorizing issues hard.Example: throw new Error("Error occurred"); Why It Matters: Custom error classes make error handling more precise and help segregate application errors (e.g., validation issues) from system errors (e.g., database failures). 3. Include Contextual Information in Logs Good Practice: Add relevant information like requestId, timestamp, and input data (excluding sensitive information) when logging errors.Example: console.error({     errorType: "ValidationError",     message: "The 'email' field is missing.",     requestId: context.awsRequestId,     input: event.body,     timestamp: new Date().toISOString(), }); Bad Practice: Log errors without any context, making debugging difficult.Example: console.error("Error occurred"); Why It Matters: Contextual information in logs makes it easier to identify what triggered the error and where it happened, improving the debugging experience. Retry Logic Across AWS SDK and Other Services Retrying failed operations is critical when interacting with external services, as temporary failures (e.g., throttling, timeouts, or transient network issues) can disrupt workflows. Whether you’re using AWS SDK, third-party APIs, or internal services, applying retry logic effectively can ensure system reliability while avoiding unnecessary overhead. 1. Use Exponential Backoff and Jitter Good Practice: Apply exponential backoff with jitter to stagger retry attempts. This avoids overwhelming the target service, especially under high load or rate-limiting scenarios.Example (General Implementation): async function retryWithBackoff(fn, retries = 3, delay = 100) {     for (let attempt = 1; attempt <= retries; attempt++) {         try {             return await fn();         } catch (error) {             if (attempt === retries) throw error; // Rethrow after final attempt             const backoff = delay * 2 ** (attempt - 1) + Math.random() * delay; // Add jitter             console.log(`Retrying in ${backoff.toFixed()}ms...`);             await new Promise((res) => setTimeout(res, backoff));         }     } } // Usage Example const result = await retryWithBackoff(() => callThirdPartyAPI()); Bad Practice: Retrying without delays or jitter can lead to cascading failures and amplify the problem. for (let i = 0; i < retries; i++) {     try {         return await callThirdPartyAPI();     } catch (error) {         console.log("Retrying immediately...");     } } Why It Matters: Exponential backoff reduces pressure on the failing service, while jitter randomizes retry times, preventing synchronized retry storms from multiple clients. 2. Leverage Built-In Retry Mechanisms Good Practice: Use the built-in retry logic of libraries, SDKs, or APIs whenever available. These are typically optimized for the specific service.Example (AWS SDK): const DynamoDB = new AWS.DynamoDB.DocumentClient({     maxRetries: 3, // Number of retries     retryDelayOptions: { base: 200 }, // Base delay in ms }); Example (Axios for Third-Party APIs):Use libraries like axios-retry to integrate retry logic for HTTP requests. const axios = require('axios'); const axiosRetry = require('axios-retry'); axiosRetry(axios, {     retries: 3, // Retry 3 times     retryDelay: (retryCount) => retryCount * 200, // Exponential backoff     retryCondition: (error) => error.response.status >= 500, // Retry only for server errors }); const response = await axios.get("https://example.com/api"); Bad Practice: Writing your own retry logic unnecessarily when built-in mechanisms exist, risking suboptimal implementation. Why It Matters: Built-in retry mechanisms are often optimized for the specific service or library, reducing the likelihood of bugs and configuration errors. 3. Configure Service-Specific Retry Limits Good Practice: Set retry limits based on the service's characteristics and criticality.Example (AWS S3 Upload): const s3 = new AWS.S3({ maxRetries: 5, // Allow more retries for critical operations retryDelayOptions: { base: 300 }, // Slightly longer base delay }); Example (Database Queries): async function queryDatabaseWithRetry(queryFn) {     await retryWithBackoff(queryFn, 5, 100); // Retry with custom backoff logic } Bad Practice: Allowing unlimited retries can cause resource exhaustion and increase costs. while (true) {     try {         return await callService();     } catch (error) {         console.log("Retrying...");     } } Why It Matters: Excessive retries can lead to runaway costs or cascading failures across the system. Always define a sensible retry limit. 4. Handle Transient vs. Persistent Failures Good Practice: Retry only transient failures (e.g., timeouts, throttling, 5xx errors) and handle persistent failures (e.g., invalid input, 4xx errors) immediately.Example: const isTransientError = (error) =>     error.code === "ThrottlingException" || error.code === "TimeoutError"; async function callServiceWithRetry() {     await retryWithBackoff(() => {         if (!isTransientError(error)) throw error; // Do not retry persistent errors         return callService();     }); } Bad Practice: Retrying all errors indiscriminately, including persistent failures like ValidationException or 404 Not Found. Why It Matters: Persistent failures are unlikely to succeed with retries and can waste resources unnecessarily. 5. Log Retry Attempts Good Practice: Log each retry attempt with relevant context, such as the retry count and delay. async function retryWithBackoff(fn, retries = 3, delay = 100) {     for (let attempt = 1; attempt <= retries; attempt++) {         try {             return await fn();         } catch (error) {             if (attempt === retries) throw error;             console.log(`Attempt ${attempt} failed. Retrying in ${delay}ms...`);             await new Promise((res) => setTimeout(res, delay));         }     } } Bad Practice: Failing to log retries makes debugging or understanding the retry behavior difficult. Why It Matters: Logs provide valuable insights into system behavior and help diagnose retry-related issues. Summary of Best Practices for Retry logic AspectGood PracticeBad PracticeRetry LogicUse exponential backoff with jitter to stagger retries.Retry immediately without delays, causing retry storms.Built-In MechanismsLeverage AWS SDK retry options or third-party libraries like axios-retry.Write custom retry logic unnecessarily when optimized built-in solutions are available.Retry LimitsDefine a sensible retry limit (e.g., 3–5 retries).Allow unlimited retries, risking resource exhaustion or runaway costs.Transient vs PersistentRetry only transient errors (e.g., timeouts, throttling) and fail fast for persistent errors.Retry all errors indiscriminately, including persistent failures like validation or 404 errors.LoggingLog retry attempts with context (e.g., attempt number, delay,  error) to aid debugging.Fail to log retries, making it hard to trace retry behavior or diagnose problems. Logging Best Practices Logs are essential for debugging and monitoring Lambda functions. However, unstructured or excessive logging can make it harder to find helpful information. 1. Mask or Exclude Sensitive Data Good Practice: Avoid logging sensitive information like:User credentialsAPI keys, tokens, or secretsPersonally Identifiable Information (PII)Use tools like AWS Secrets Manager for sensitive data management.Example: Mask sensitive fields before logging: const sanitizedInput = {     ...event,     password: "***", }; console.log(JSON.stringify({     level: "info",     message: "User login attempt logged.",     input: sanitizedInput, })); Bad Practice: Logging sensitive data directly can cause security breaches or compliance violations (e.g., GDPR, HIPAA).Example: console.log(`User logged in with password: ${event.password}`); Why It Matters: Logging sensitive data can expose systems to attackers, breach compliance rules, and compromise user trust. 2.  Set Log Retention Policies Good Practice: Set a retention policy for CloudWatch log groups to prevent excessive log storage costs.AWS allows you to configure retention settings (e.g., 7, 14, or 30 days). Bad Practice: Using the default “Never Expire” retention policy unnecessarily stores logs indefinitely. Why It Matters: Unmanaged logs increase costs and make it harder to find relevant data. Retaining logs only as long as needed reduces costs and keeps logs manageable. 3. Avoid Excessive Logging Good Practice: Log only what is necessary to monitor, troubleshoot, and analyze system behavior.Use info, debug, and error levels to prioritize logs appropriately. console.info("Function started processing..."); console.error("Failed to fetch data from DynamoDB: ", error.message); Bad Practice: Logging every detail (e.g., input payloads, execution steps) unnecessarily increases log volume.Example: console.log(`Received event: ${JSON.stringify(event)}`); // Avoid logging full payloads unnecessarily Why It Matters: Excessive logging clutters log storage, increases costs, and makes it harder to isolate relevant logs. 4. Use Log Levels (Info, Debug, Error) Good Practice: Use different log levels to differentiate between critical and non-critical information.info: For general execution logs (e.g., function start, successful completion).debug: For detailed logs during development or troubleshooting.error: For failure scenarios requiring immediate attention. Bad Practice: Using a single log level (e.g., console.log() everywhere) without prioritization. Why It Matters: Log levels make it easier to filter logs based on severity and focus on critical issues in production. Conclusion In this episode of "Mastering AWS Lambda with Bao", we explored critical best practices for building reliable AWS Lambda functions, focusing on optimizing performance, error handling, and logging. Optimizing Performance: By reducing cold starts, using smaller deployment packages, lightweight runtimes, and optimizing VPC configurations, you can significantly lower latency and optimize Lambda functions. Strategies like moving initialization outside the handler and leveraging Provisioned Concurrency ensure smoother execution for latency-sensitive applications.Error Handling: Implementing structured error responses and custom error classes makes troubleshooting easier and helps differentiate between transient and persistent issues. Handling errors consistently improves system resilience.Retry Logic: Applying exponential backoff with jitter, using built-in retry mechanisms, and setting sensible retry limits optimizes that Lambda functions gracefully handle failures without overwhelming dependent services.Logging: Effective logging with structured formats, contextual information, log levels, and appropriate retention policies enables better visibility, debugging, and cost control. Avoiding sensitive data in logs ensures security and compliance. Following these best practices, you can optimize lambda function performance, reduce operational costs, and build scalable, reliable, and secure serverless applications with AWS Lambda. In the next episode, we’ll dive deeper into "Handling Failures with Dead Letter Queues (DLQs)", exploring how DLQs act as a safety net for capturing failed events and ensuring no data loss occurs in your workflows. Stay tuned! Note: 1. Provisioned Concurrency is not a universal solution. While it eliminates cold starts, it also incurs additional costs since pre-initialized environments are billed regardless of usage. When to Use:Latency-sensitive workloads like APIs or real-time applications where even a slight delay is unacceptable.When Not to Use:Functions with unpredictable or low invocation rates (e.g., batch jobs, infrequent triggers). For such scenarios, on-demand concurrency may be more cost-effective.

              13/01/2025

              52

              Bao Dang D. Q.

              Knowledge

              +0

                Best Practices for Building Reliable AWS Lambda Functions

                13/01/2025

                52

                Bao Dang D. Q.

                Customize software background

                Want to customize a software for your business?

                Meet with us! Schedule a meeting with us!